Resolve incidents faster with intelligent triage
WHAWIT connects to your existing Datadog, New Relic, and CloudWatch setup. Our AI analyzes millions of log entries in seconds, surfaces root causes, and suggests fixes — so your team can ship instead of debug.
No credit card required · 5-minute setup · SOC 2 ready
Integrations
Works with your existing
observability stack


Plus 15+ more providers including Sentry, Grafana, BetterStack, and custom integrations
How it works
Get up and running in minutes, not weeks. No migration, no agent installation.
Connect
Link your existing monitoring tools with read-only access. Setup takes under 5 minutes.
Analyze
Our AI processes millions of log entries instantly, detecting patterns and anomalies.
Resolve
Get clear root cause analysis, suggested fixes, and automated ticket creation.
On-call shouldn't feel like this
Your on-call engineers waste hours on noise, context switching, and bookkeeping instead of actually fixing things.
Alert Noise
Sifting through #operations channels
- Single issue triggers dozens of alerts across Slack, PagerDuty, and email
- Multiple simultaneous issues cause interspersed, unrelated alerts
WHAWIT deduplicates and correlates related alerts into a single incident with full context.
Tool Sprawl
Context switching between tools
- Jumping between Honeycomb, Grafana, GoCD, CloudWatch, and your terminal
- Manually piecing together logs, metrics, and deployment history
One unified view of logs, metrics, traces, and deployments. No more tab juggling.
Ticket Hell
Jira bookkeeping
- Finding root cause tickets for recurring issues across projects
- Writing JQL queries just to figure out if this happened before
Auto-creates Jira tickets with root cause and links to past incidents. Zero JQL required.
Centralized incident command
Stop context-switching between tools during outages. The On-Call Hub brings together alerts, logs, metrics, and AI analysis into a single view — so your on-call engineers can resolve incidents in minutes, not hours.
Smart Alert Routing
Reduces alert noise by 85%. Only get paged for real issues that need human attention.
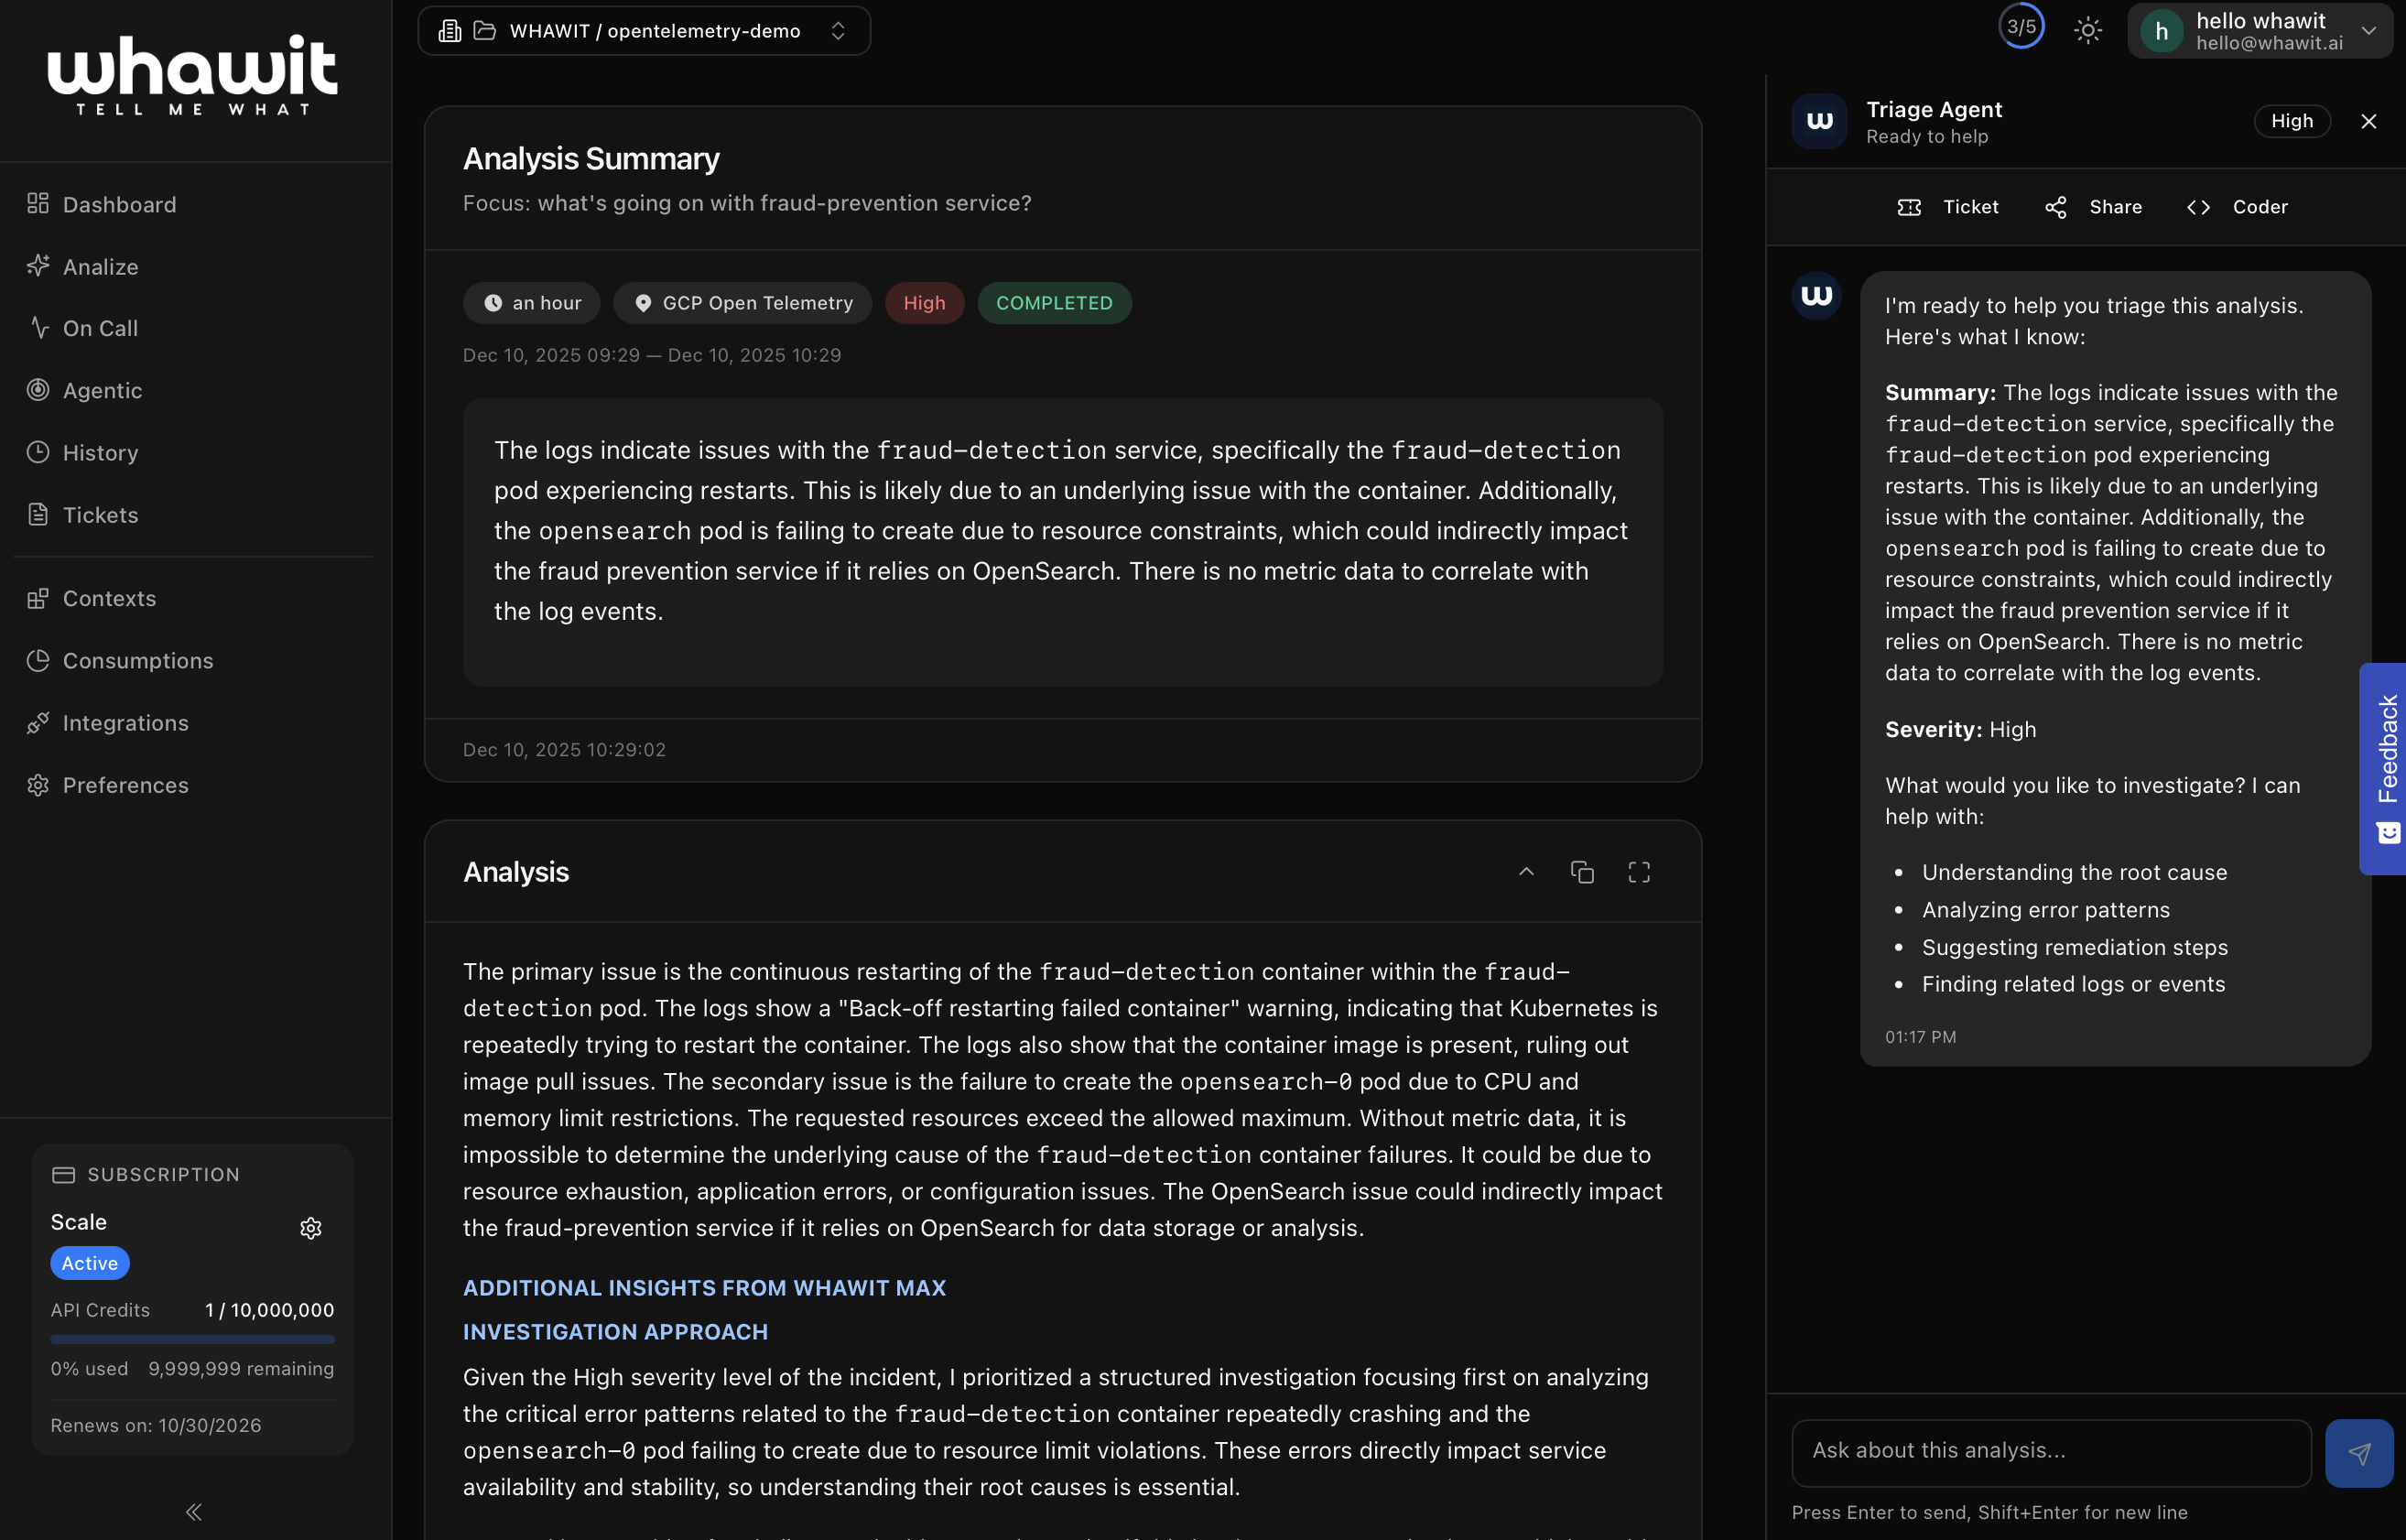
Agentic Triage
AI investigates incidents interactively — ask questions, validate hypotheses, and get to root cause faster.
Natural-Language Summaries
Every incident gets a clear, plain-English summary so anyone on the team can understand what happened.
Event Timelines
Visualize the full incident lifecycle from first alert to resolution with correlated logs and metrics.
Escalation Management
Automated escalation paths ensure the right person is notified at the right time, every time.
Team Collaboration
Shared incident context and action items so your whole team can coordinate without playing detective.
Database connection pool exhausted
Detected 4 min ago · us-east-1 · prod-api
The auth-svc deployment at 11:58 introduced a connection leak in the OAuth flow. Each request opens a new DB connection without releasing it. Recommend rolling back to v2.4.1 and setting max pool connections to 50.
Ask your AI about production incidents
Use natural language to query incidents, run analysis, and get fix suggestions directly in Cursor, Kiro, or any MCP-compatible IDE. 8 powerful tools at your command.
"Do we have any errors on OMS in the last 24 hours with the orders?"
Open Incident Detected
There's a HIGH severity incident for oms-core: Event processing pipeline queue is FULL...
whawit_context_search
Search across your project context to find relevant logs, errors, and patterns.
whawit_devops_analysis
Run comprehensive DevOps analysis on your infrastructure and services.
whawit_project_info
Get detailed information about a specific project including status and config.
whawit_list_projects
List all available projects in your Whawit workspace.
whawit_get_analysis_full
Retrieve the complete analysis with all details, insights, and recommendations.
whawit_get_incident_full
Get full incident details including severity, timeline, and affected services.
whawit_generate_fix_prompt
Generate AI-powered fix suggestions based on the incident analysis.
whawit_codebase_analysis_prompt
Analyze your codebase for potential issues related to incidents.
Works with
 Cursor
 Kiro
Kiro VS Code
 Windsurf
 Antigravity
See it in action
Watch a quick overview or explore interactive demos to see how WHAWIT transforms your debugging workflow.

A Message from Our Co-Founder
José Escrich, Enterprise Software Architect with over 25 years of field experience, explains the essence of Whawit and how it works.
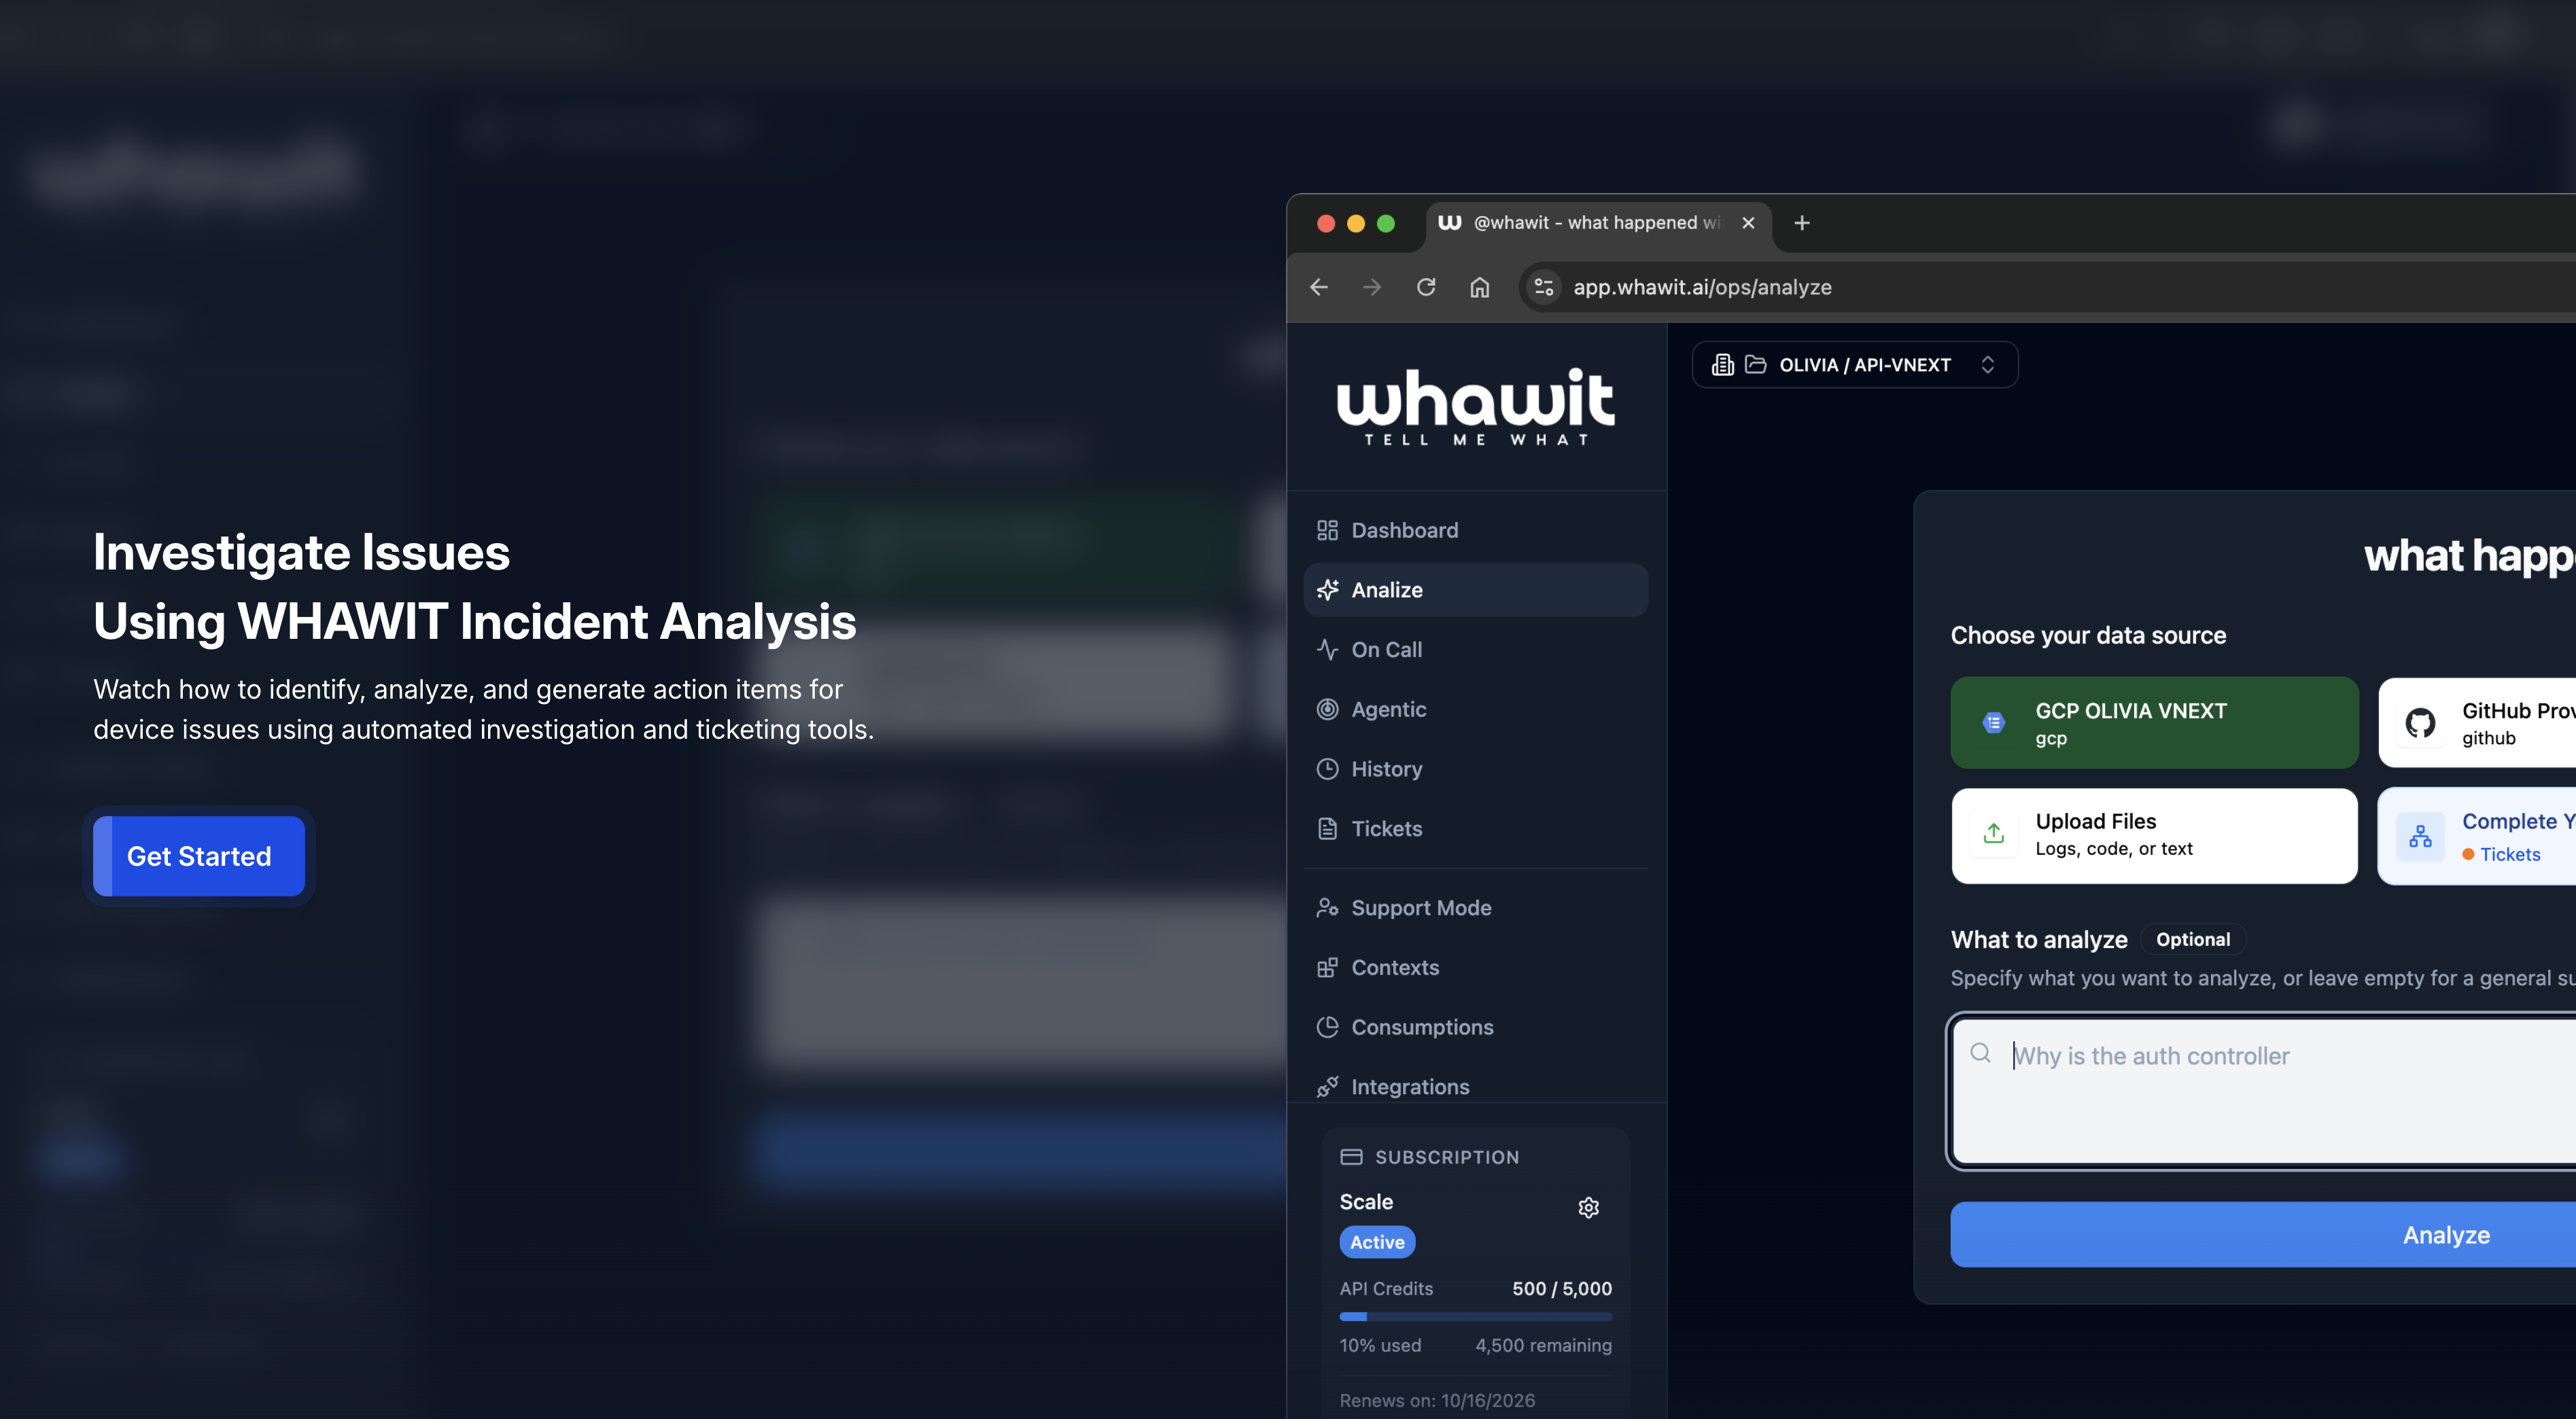
Investigate Device Issues
Analyze logs from edge devices to find root causes instantly.
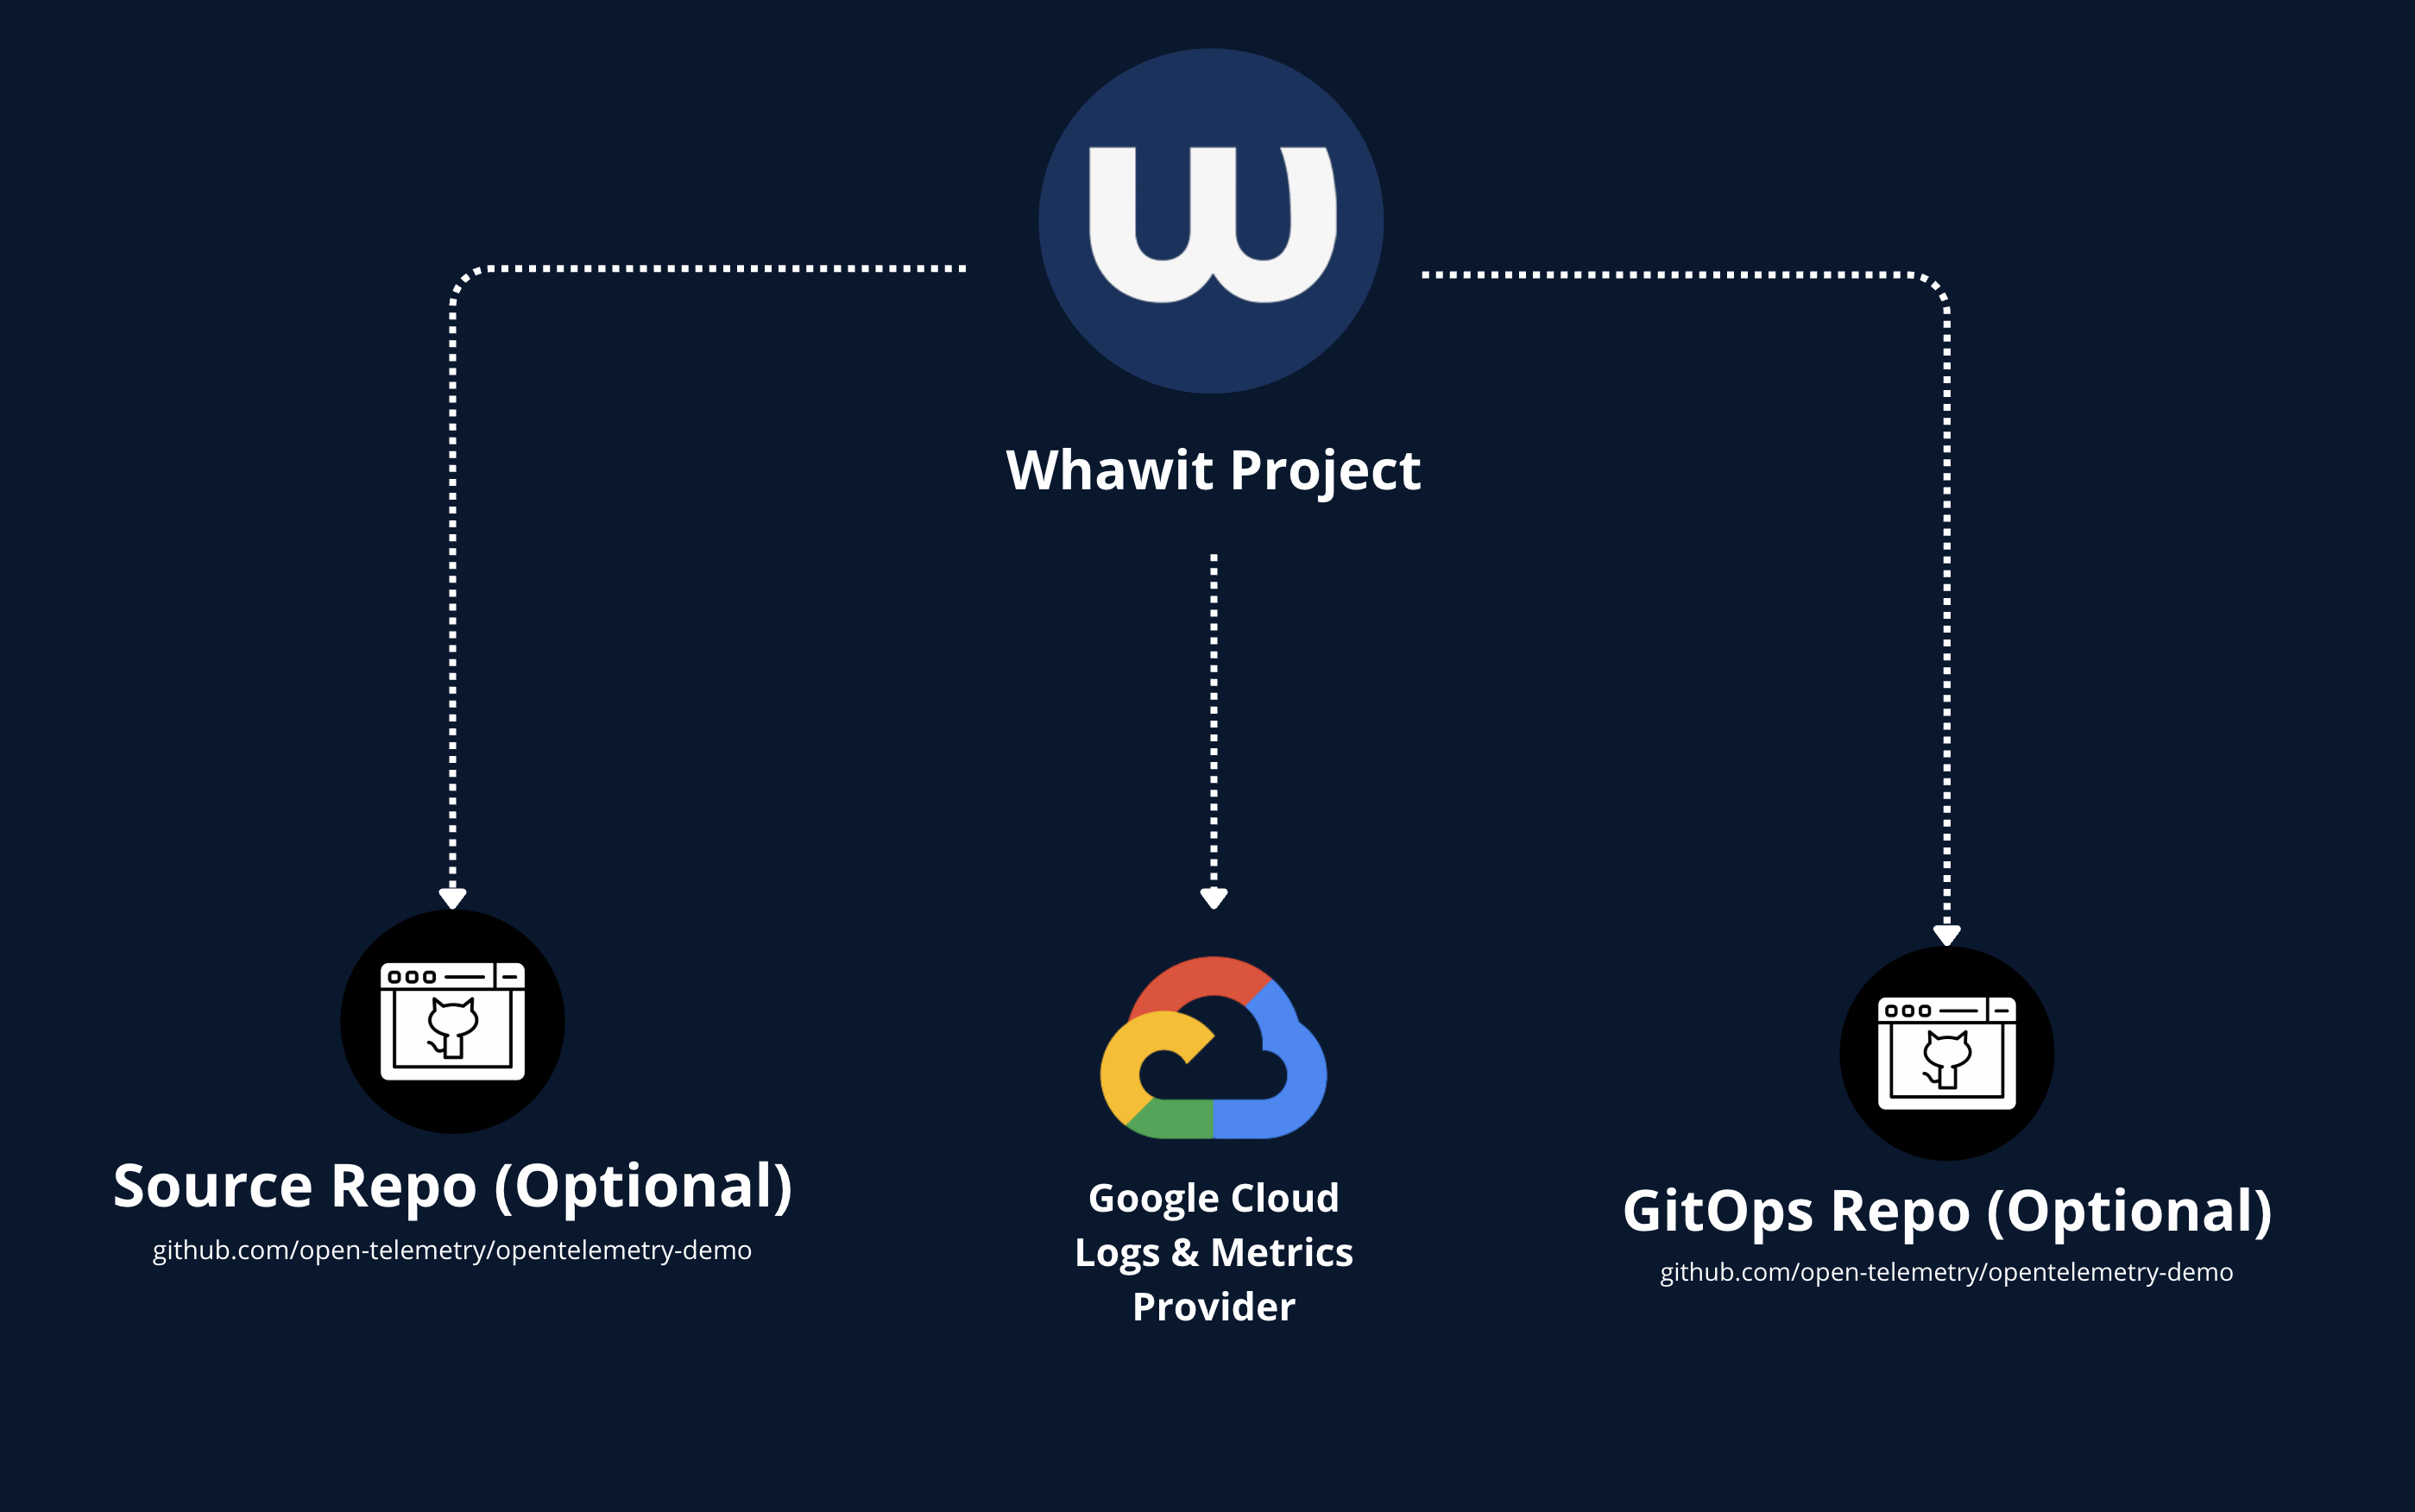
Real Case: GCP & Kubernetes
See WHAWIT analyze a complex incident in a cloud-native environment.
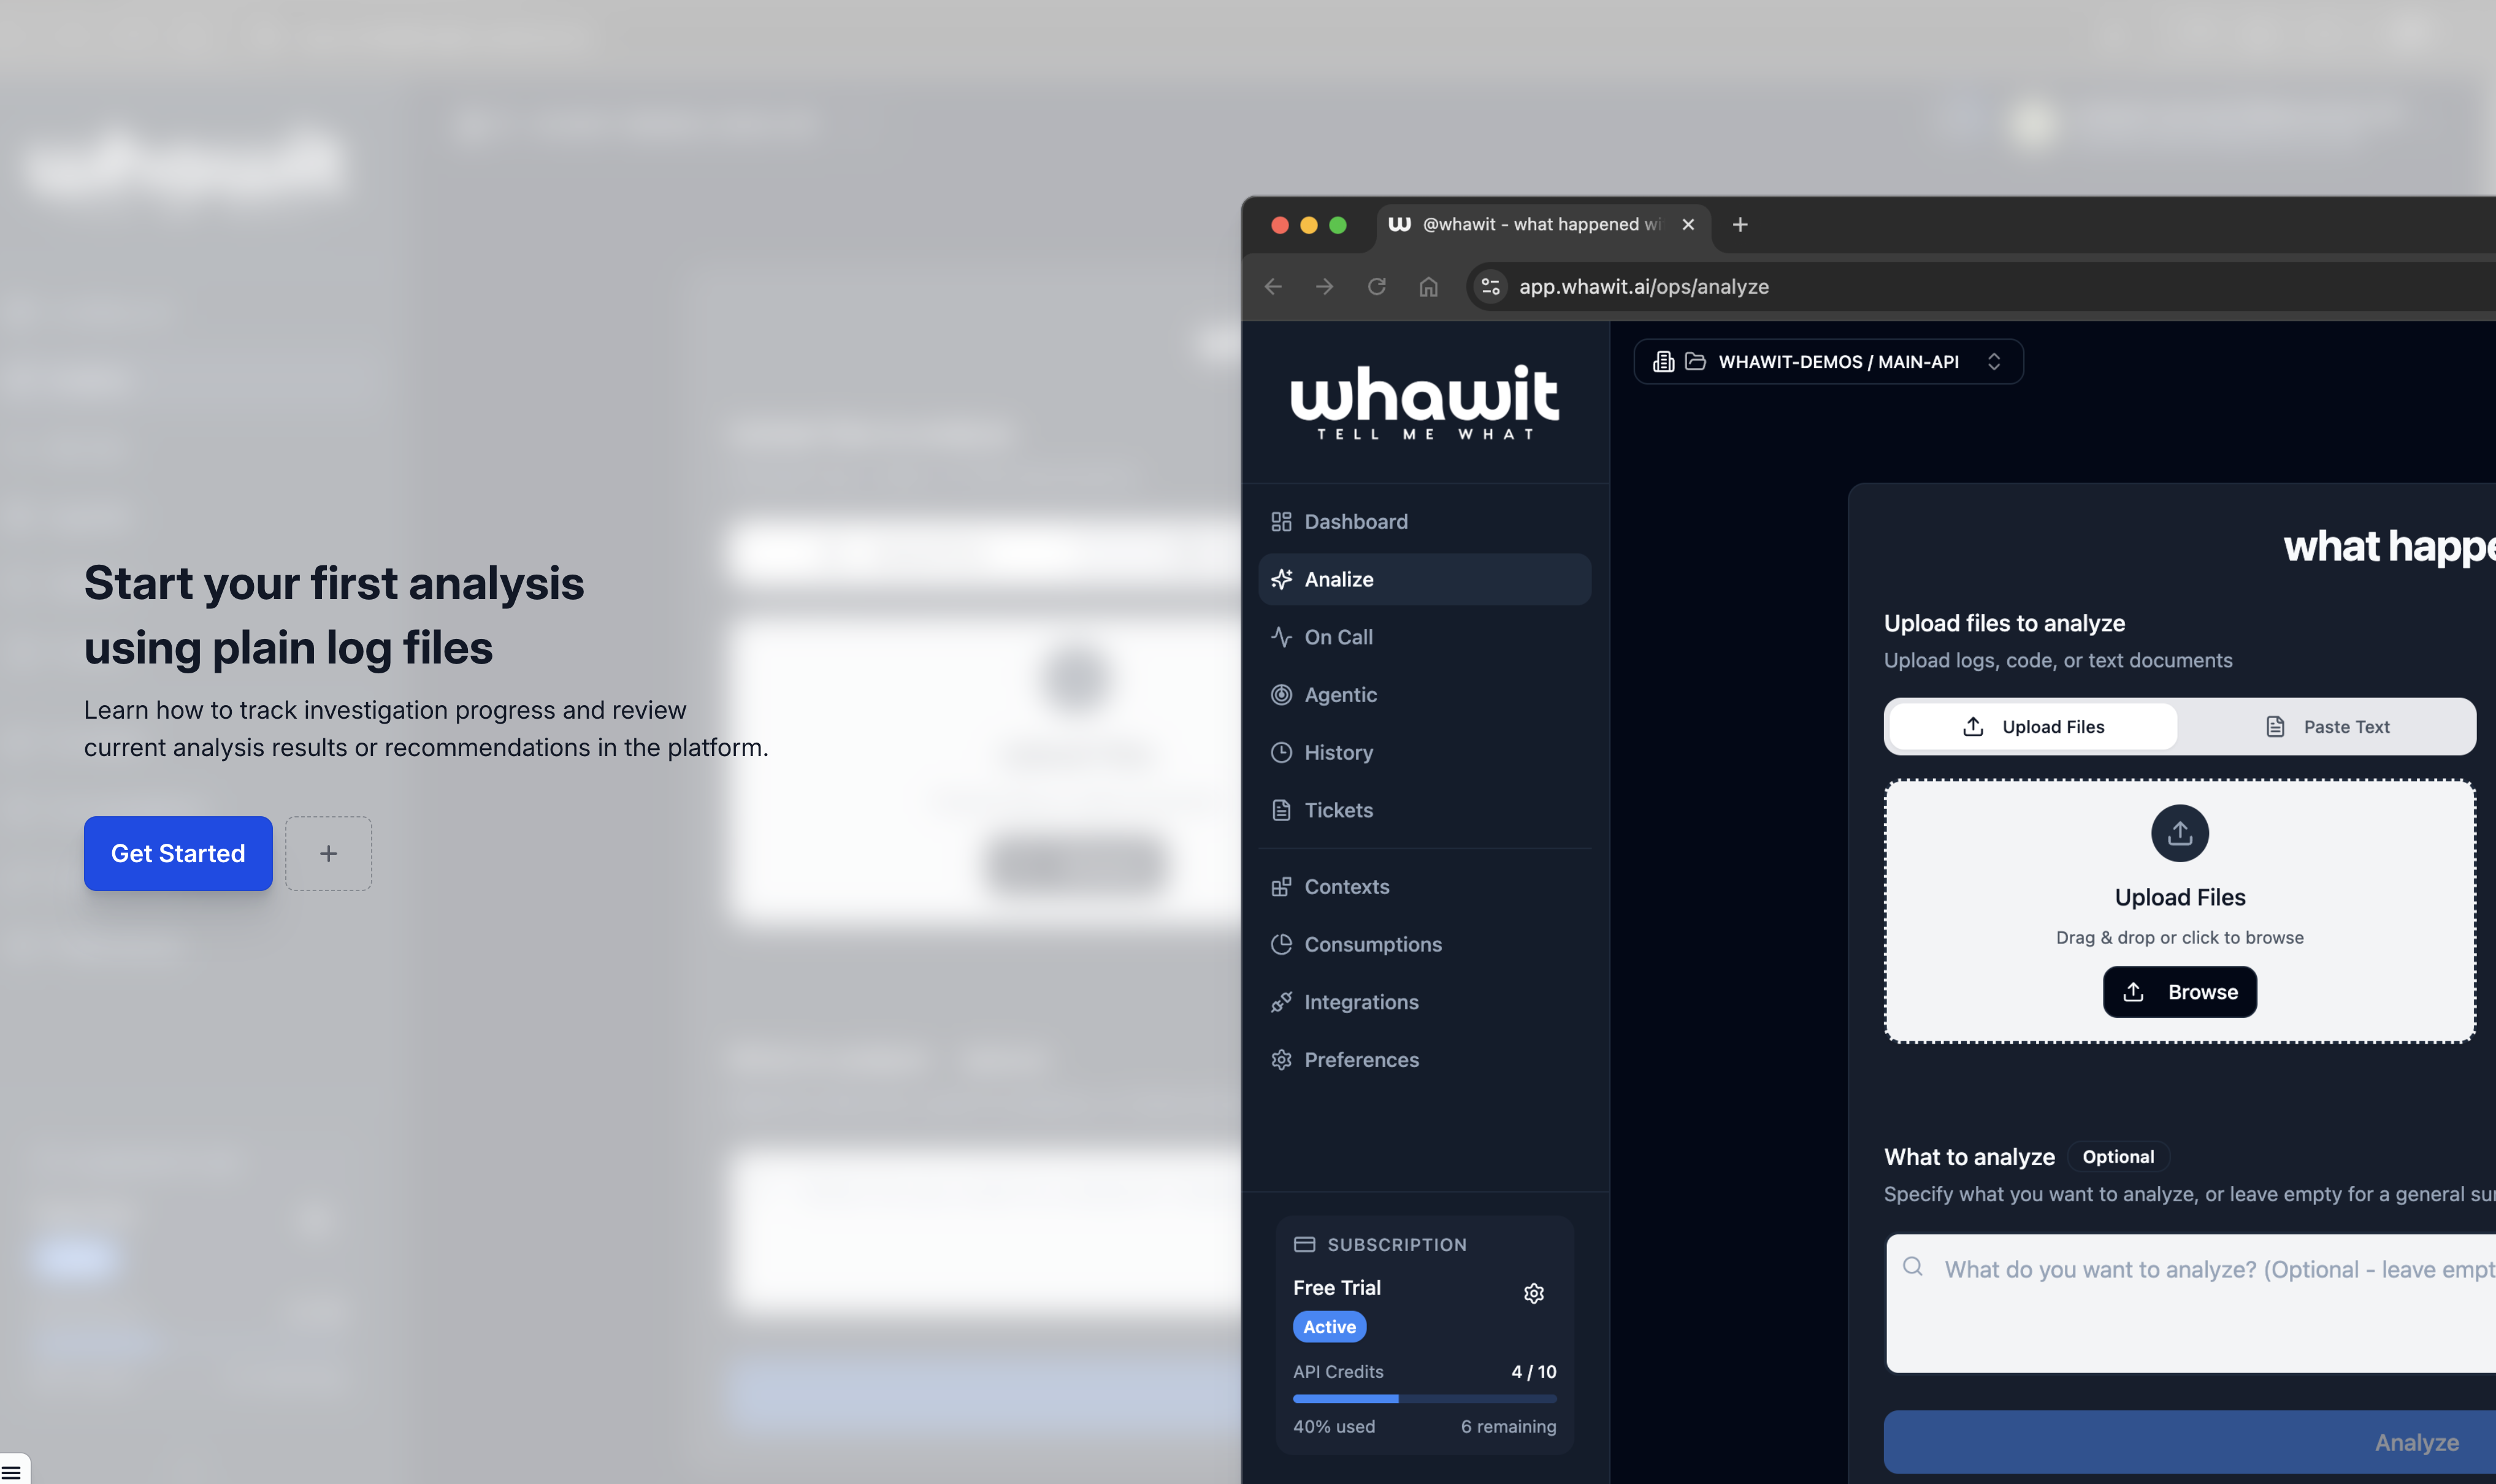
Start Your First Analysis
Learn how to track progress and review AI recommendations.
Debug without leaving your editor
Investigate incidents directly in VS Code, Cursor, Windsurf, Kiro, and more.
VS Code Extension
Real-time incident tracking, analysis history, and cloud integrations directly in your editor.
MCP Server
Natural language queries for incidents in Cursor, Kiro, and other AI-powered IDEs.
Start resolving incidents faster
Keep your existing tools. Add an intelligence layer that cuts debugging time by 85% and gives your team instant, actionable answers.